Catchments and water quality
Did you know that “everyone” lives in a catchment?
A catchment is just like a bathtub. It’s an area of land surrounded by natural features such as hills or mountains from which all runoff water (rainfall) flows to a low point such as the Mooloolah River mouth at Mooloolaba for example.
Each catchment has a range of different land uses occurring within them. These land uses have the potential to produce different pollutant types that can lead to a deterioration in water quality. There are three land uses occurring in the Mooloolah catchment (refer model below); these are grazing and agriculture in the upper reaches and urban development in the lower Mooloolaba area.
Catchment health and water quality are closely linked and in general, if the catchment is healthy and in good condition, water quality also tends to be good.
Mooloolah River catchment conceptual model
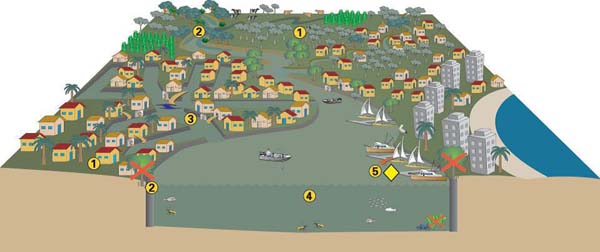
- Catchment land-use is dominated by natural forest, grazing and agriculture (upper reaches) and urban (lower reaches)
- Stream bank vegetation in upper reaches in good condition; hardened surfaces have replaced most riparian and aquatic vegetation in lower reaches
- Creation of canals has led to substantial channel modification
- Water looks clean and clear in most sections
- Ship pollution is a growing water quality issue.
The Australian and New Zealand guidelines for fresh and marine water quality (the ANZECC 2000 guidelines) are the primary reference for assessing and managing water quality. Water quality can be measured by assessing physical, chemical or biological indicators. Some of these indicators include:
- physical – temperature, turbidity, salinity, dissolved and suspended solids, clarity and colour
- chemical – pH, dissolved oxygen and nutrients
- biological – bacteria, algae and macro-invertebrates.
Measuring the above indicators provides information on the general health of the waterway and helps detect any unwanted changes. This water quality information can then be used to manage the creek or stream to ensure that the water quality is maintained and protected. One of the best ways to improve water quality is to maintain and restore the vegetation along the stream bank.
Sunshine Coast Council monitors water quality in our catchments and provides advice to residents.
So next time you’re out and about, have a look at the catchment and waterway and see if you can see the linkages between a healthy catchment and a healthy stream.
For more information on water quality guidelines, visit Department of Environment and Heritage Protection’s website.