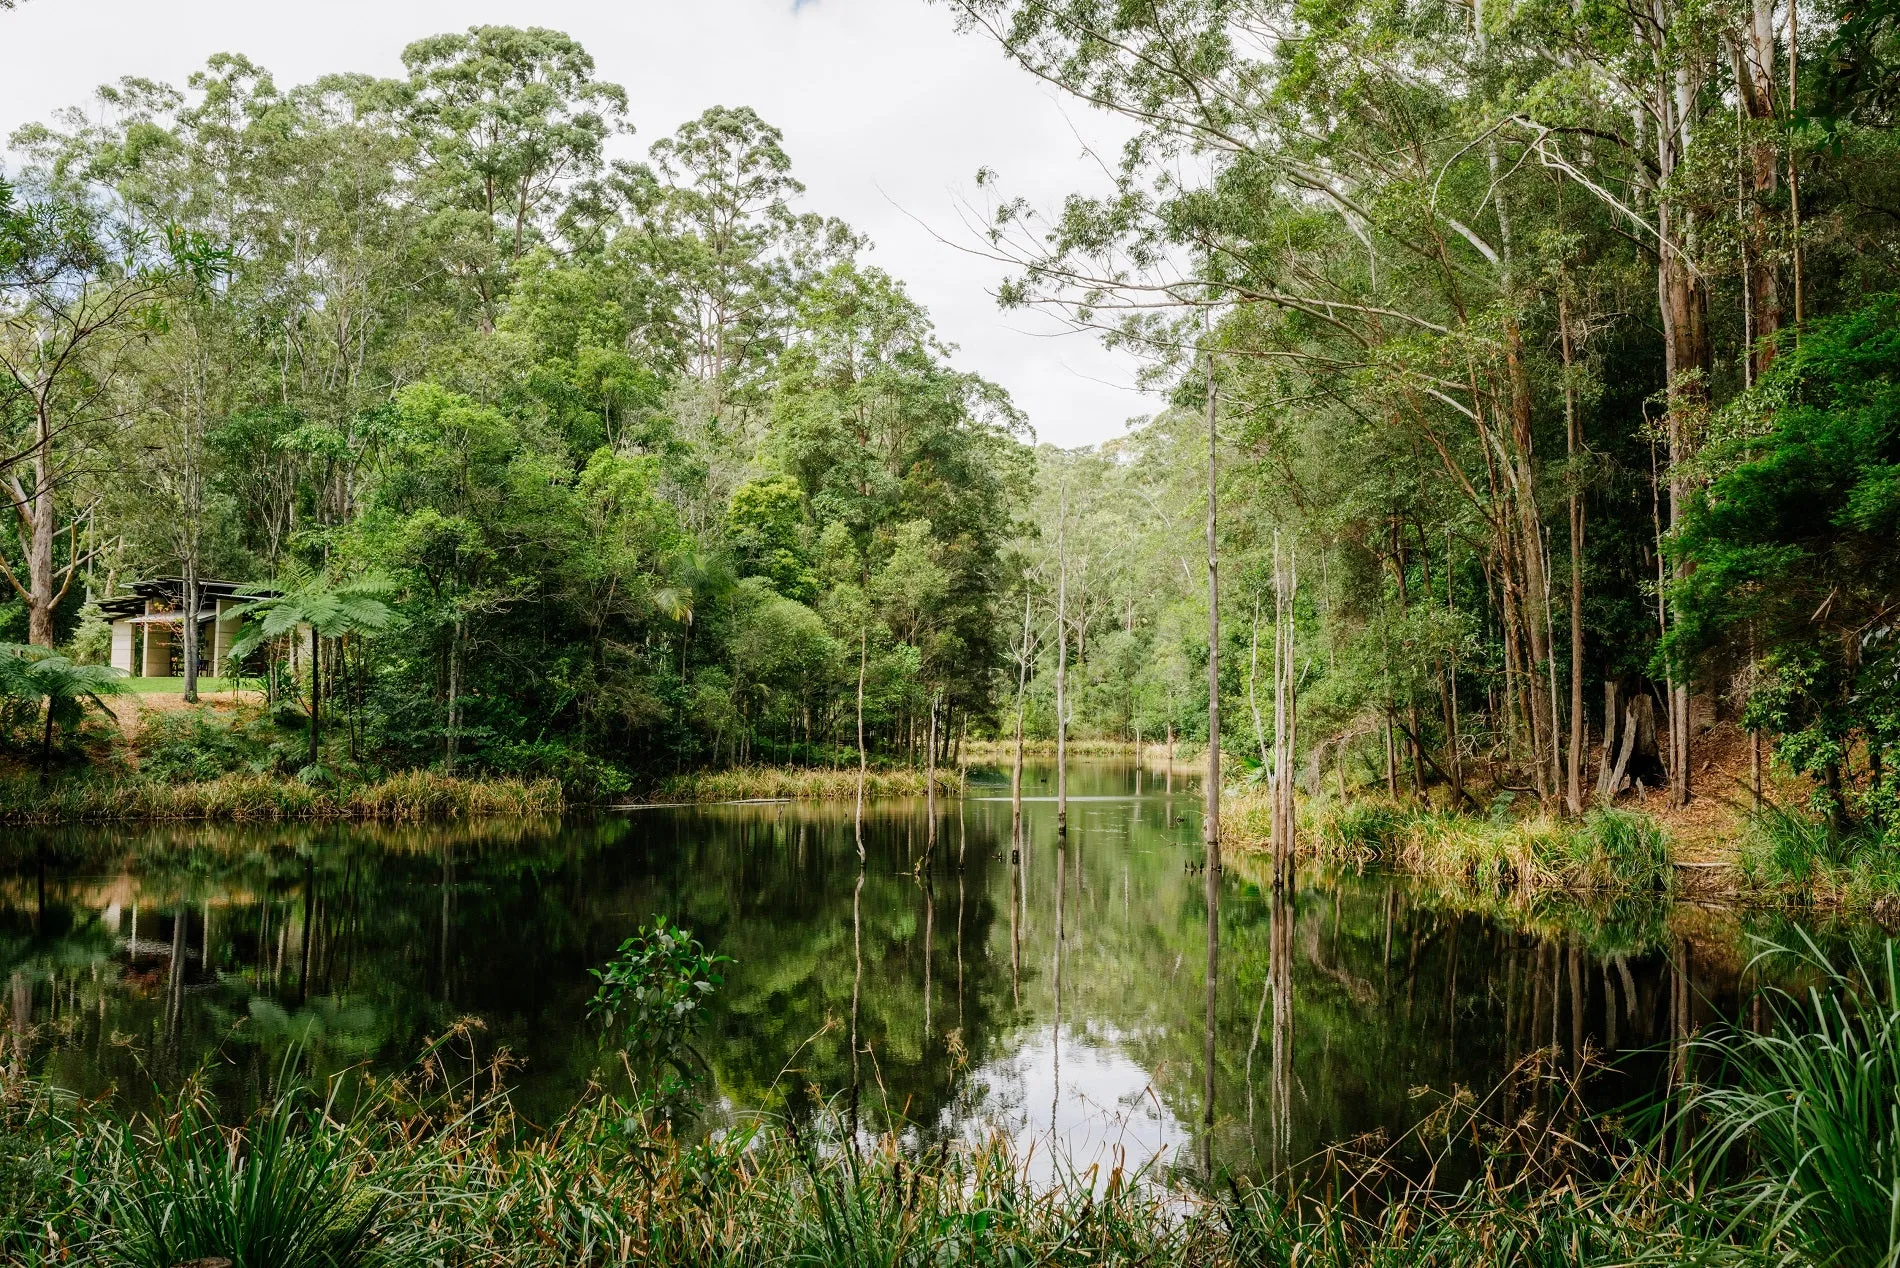
‘World first’ way we'll protect our natural assets
What makes our region’s ecosystems precious? The “big picture” answer has been revealed with the launch of a world-first mapping product for all to explore and understand the different services provided by our ecosystems.

What makes our region’s ecosystems precious? The “big picture” answer has been revealed with the launch of a world-first mapping product for all to explore and understand the different services provided by our ecosystems.
Sunshine Coast Council and the University of the Sunshine Coast have joined forces to create a “world-first” ecosystem function mapping resource that anyone can use, as part of the joint Valuing the Sunshine Coast’s Natural Assets research project.
Extracting and bringing together data from a number of previous studies and reports, the Ecosystem Function Mapping and Reporting Tool shows the different ecosystem services for every location across the region and highlights “hot spots” that provide multiple services.
Ecosystem services are the benefits each type of ecosystem provides, including climate regulation, pollination, food supply, habitat and more.
These are vital for supporting both natural environments and people, so understanding their location and role will help inform and balance decisions that will benefit generations to come.
Governments, industry groups, businesses and community members will be able to access, learn from and use the data to investigate any location – from rainforests to floodplains and even built environments.
The tool also offers the option to overlay mapping from Council and the State Government’s protected areas, planning scheme information and much more.
Project lead Dr Graham Ashford said the project team had already used the tool to fulfill requests from Council staff, including information assisting advocacy and planning efforts for some of our major green spaces.
“The Ecosystem Function Mapping and Reporting Tool is the first and only such platform in operation anywhere in the world, to our knowledge,” Dr Ashford said.
Environment Portfolio Councillor Peter Cox said the research and mapping tool was already improving the way Council made decisions by providing the “big picture” on the region’s ecosystem services.
“This is a fantastic addition to Council’s decision-making toolkit, with potential applications across the organisation,” Cr Cox said.
“Up until this point, we’ve been able to consider this information in a piecemeal way, rather than as a holistic system approach that provides a bird’s-eye view of our region.
“These are incredibly complex considerations that this research has been able to simplify to the point where they can be incorporated into decision making.”
Environment portfolio Councillor Maria Suarez said the tool could highlight valuable locations for conservation, inform planning and development decisions, or help understand the impacts of different scenarios.
“Council can use this tool alongside other considerations, including the specifics of a site: its health, fragmentation, its importance for endangered species, or benefits to the local community’s health and wellbeing,” Cr Suarez said.
The project was delivered through the Regional Partnership Agreement between Council and UniSC, which supports research improving outcomes for a sustainable Sunshine Coast.
Understanding the true impacts of our ecosystems
Cr Suarez said the project provided clear evidence on the interconnectedness between the health of the natural environment, communities and the local economy.
“This proves in both ecological and economic terms what we already know: the benefits our region’s ecosystems provide are virtually priceless.
“It shows the incredibly high return we receive on our environment spending and is a vital consideration for the way we conduct business, manage growth and plan for the future.”
How the mapping tool works
Researchers defined 19 types of ecosystem services, including pollination, climate regulation, habitat, water quality regulation and landscape opportunity, and ranked each ecosystem type’s contribution to that function.
For example, a rainforest provides high value across most ecosystem functions, while public parks and gardens offer low and mid-range function across most indicators.
Others are more varied, for example sugar cane plantations have no pollination function, low climate regulation, and relatively high food, raw materials and biological control benefits.
When these functions are mapped, the visual format shows exactly where our ecosystem functions lie across the region, and which areas are most valuable from a holistic ecological perspective.
The Ecological Functions mapping tool is available publicly online, along with instructional videos and ecosystem function explanations to guide users through the tool’s use and functionality.
